
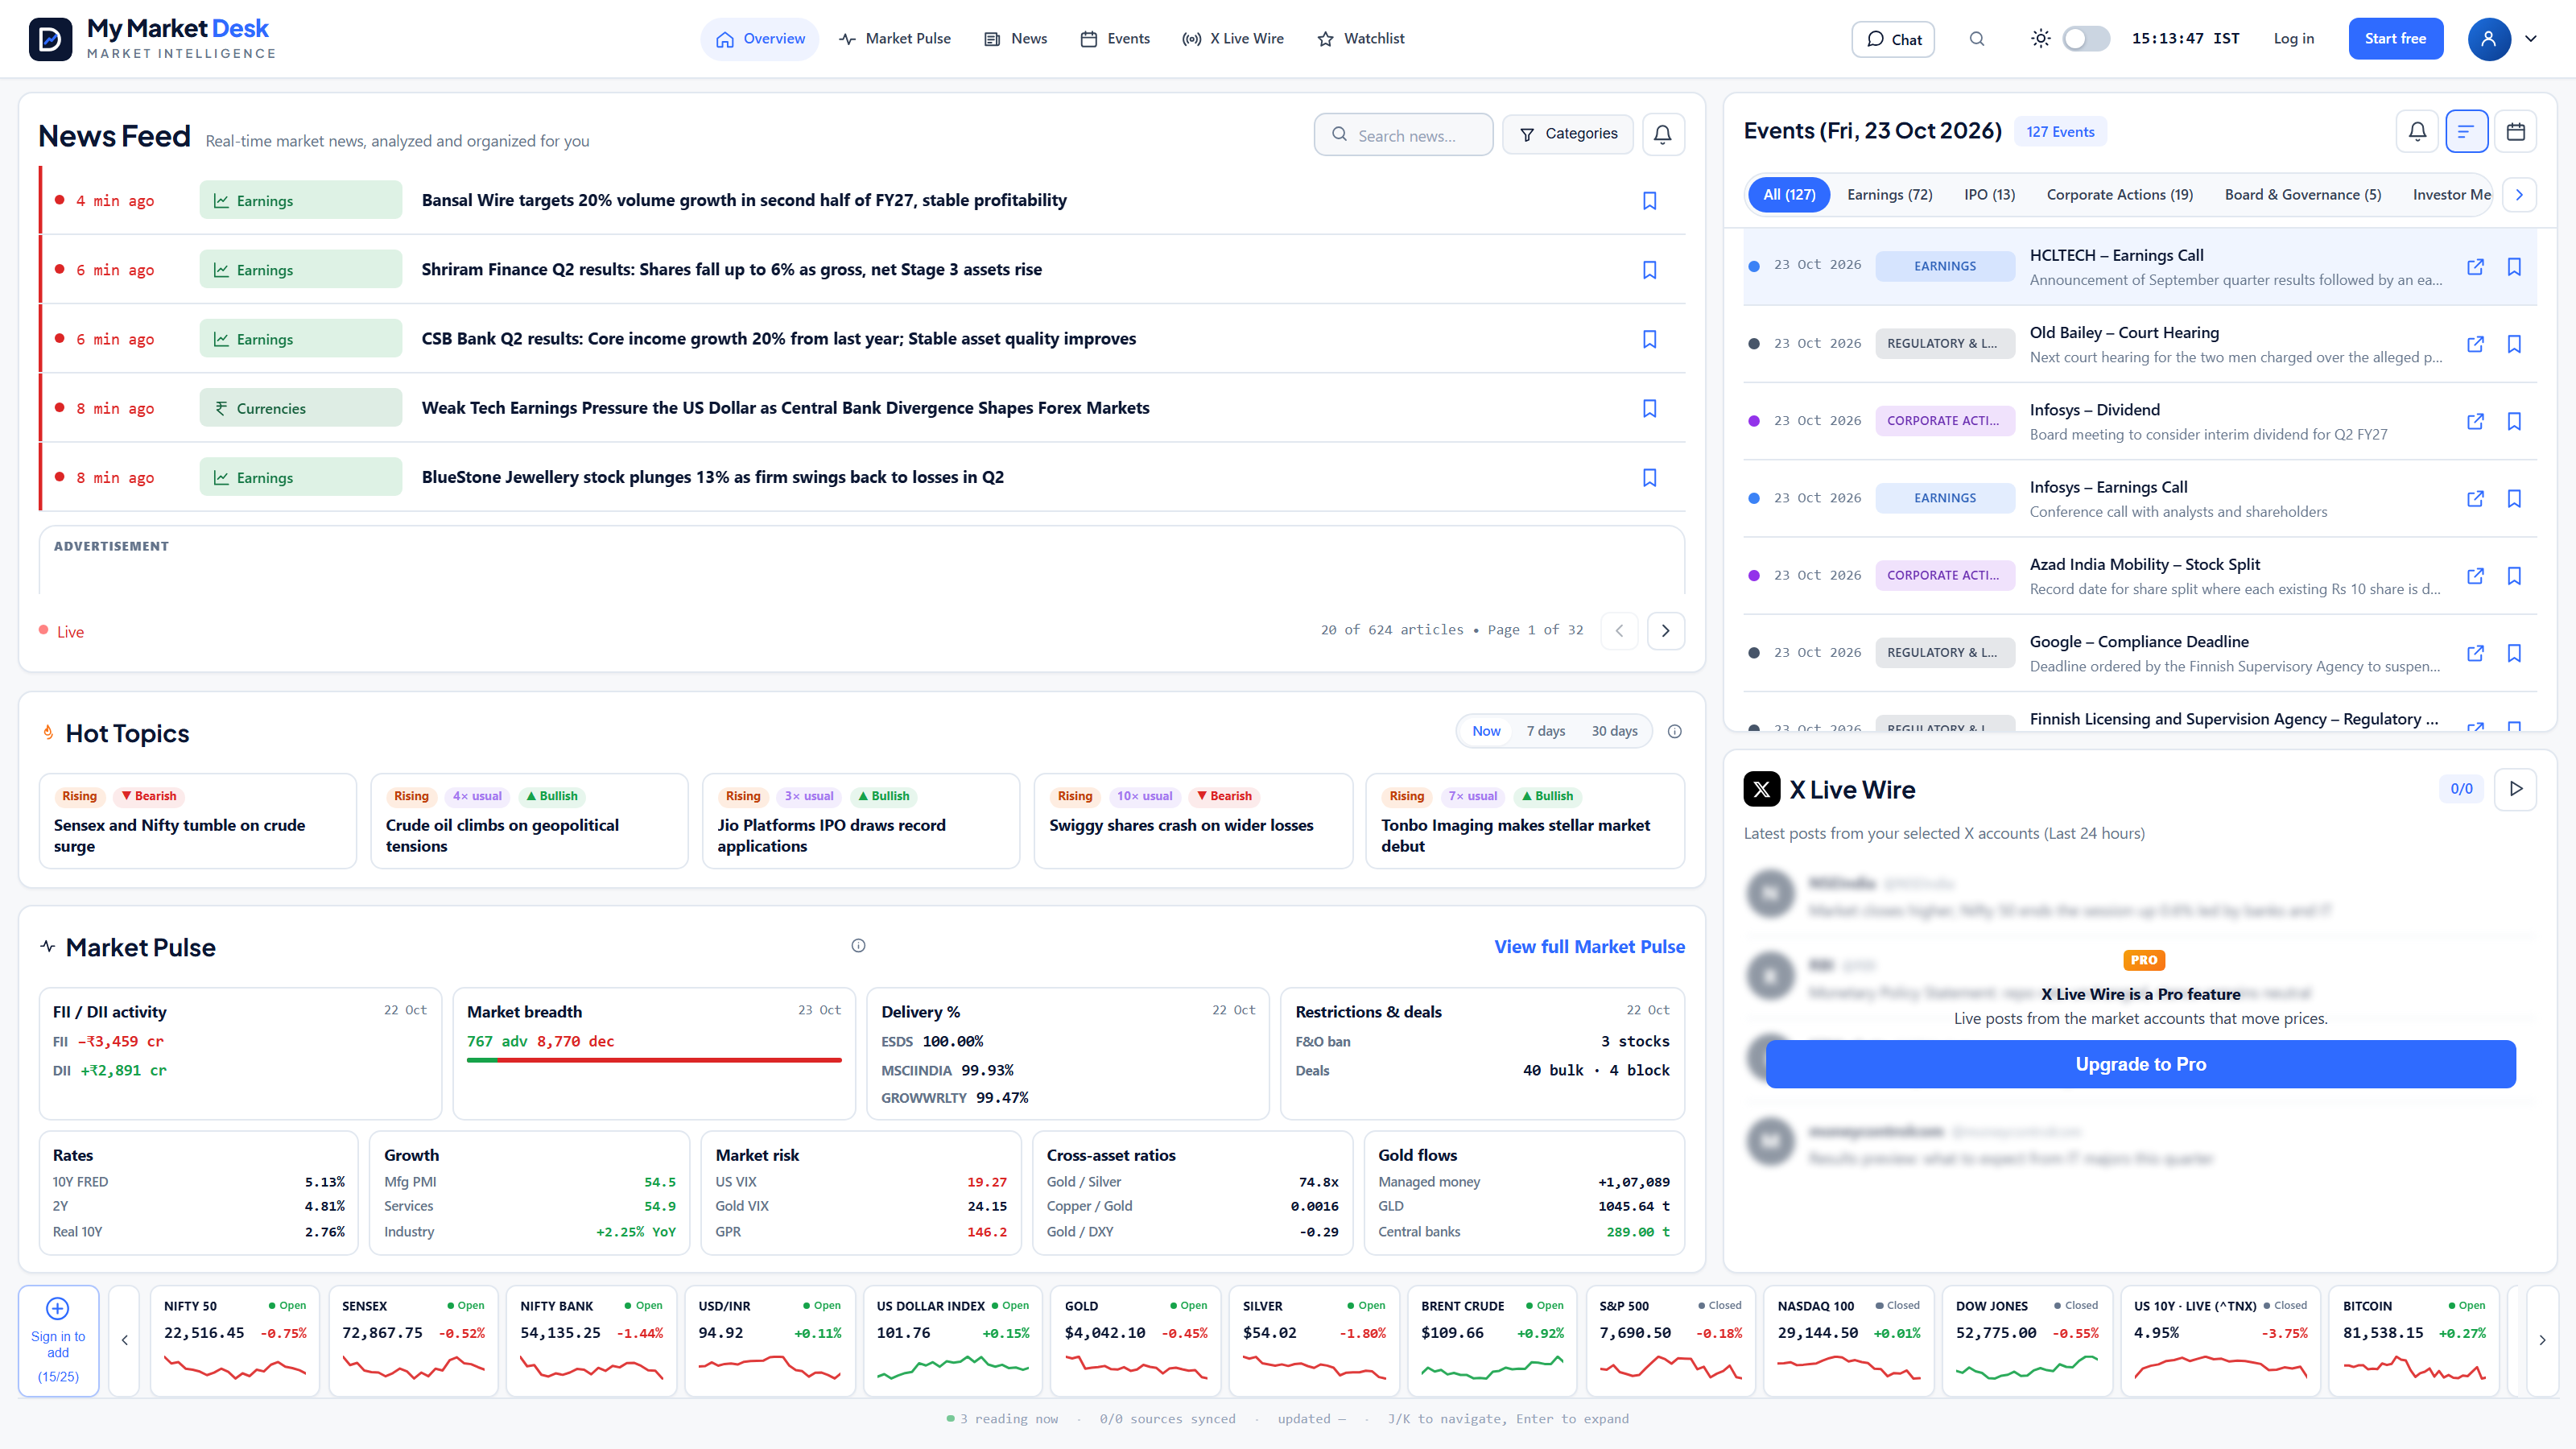
Your complete market intelligence desk
Real-time market news, Hot Topics, NSE activity and global indicators, personalised price tickers, charts, AI analysis and a complete market calendar. All in one desk.
The news feed is free. No card needed. See features.
News from outlets including
- Economic Times
- Business Standard
- LiveMint
- CNBC-TV18
- NDTV Profit
- The Hindu BusinessLine
- CNBC
- AP News
- BBC
- Al Jazeera
- NSE filings
- RBI & Fed calendars
Everything that moves the market, in one place
Stop switching between ten tabs. My Market Desk brings the news, the dates and the prices together.
News Feed
Live market news in 19 categories, from results and IPOs to RBI policy and commodities.
Event Calendar
Earnings dates, IPOs, dividends, board meetings, RBI and Fed meetings, data releases.
Market Pulse
NSE flows, breadth, delivery and deals first, with rates, volatility, PMI, positioning and demand for context.
Your price strip
15 essential benchmarks first, then 10 instruments you choose on Free. Every user keeps their own list.
Hot Topics
The ten topics moving the market right now, and why they matter.
X Live Wire PRO
Live posts from the X accounts you choose to follow, as they happen.
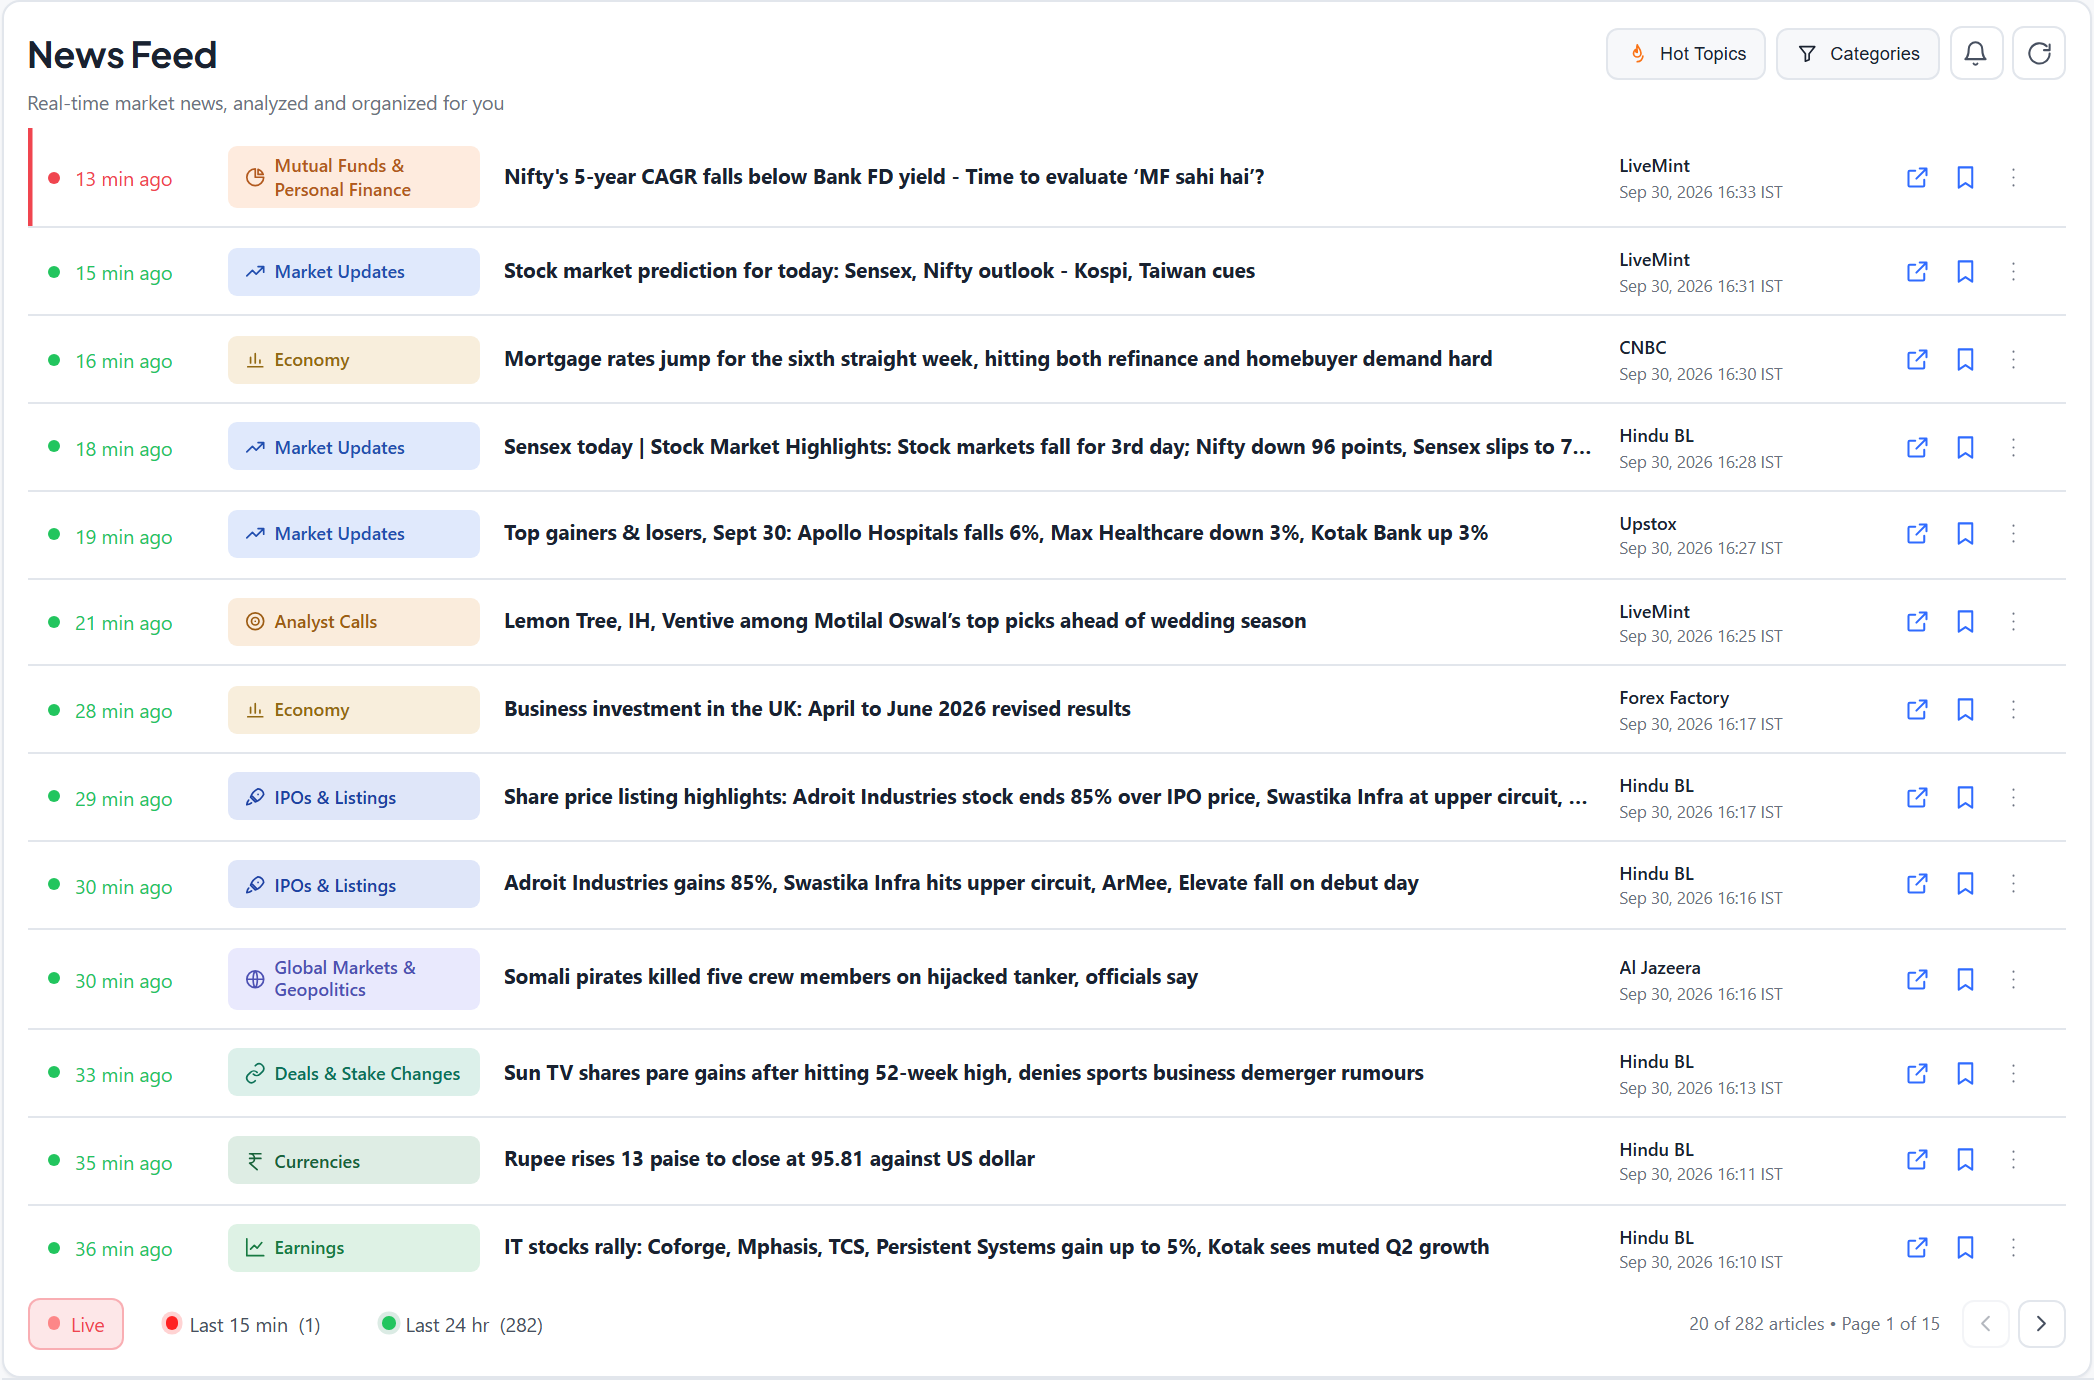
Read the market in minutes, not hours
Every headline is sorted into a category you care about, from Earnings and IPOs to Central Banks and Commodities, and marked by how fresh it is.
- 19 categories, one click to filter
- Hot Topics: the ten topics moving the market now
- Live, last 15 minutes and last 24 hours views, with desktop notifications
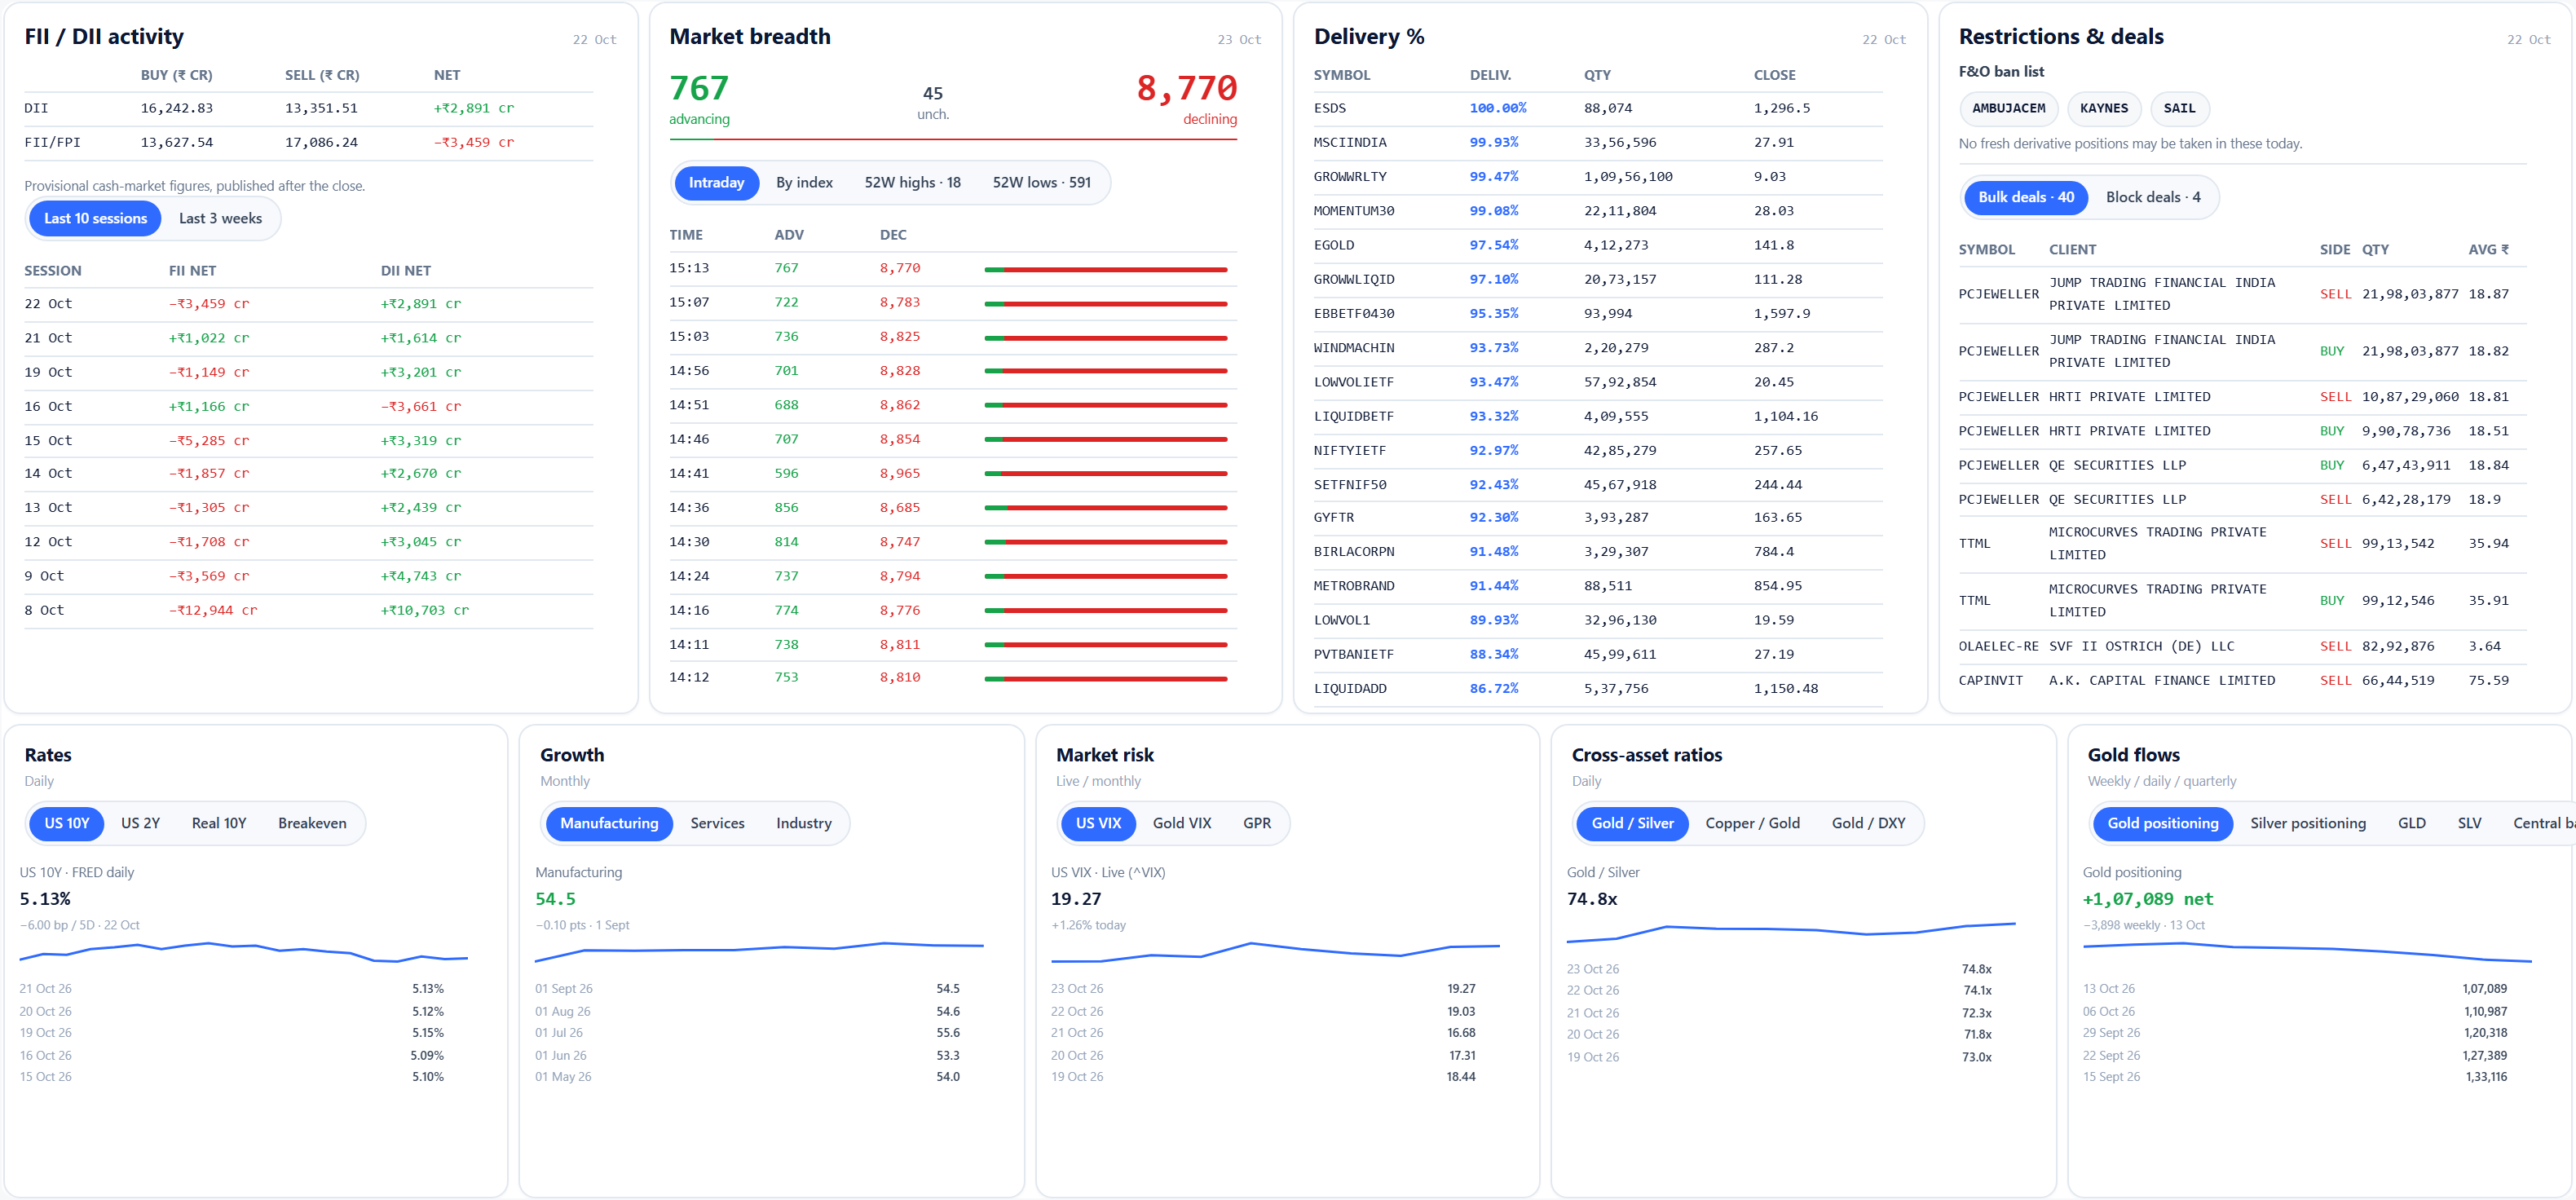
See Indian activity first, then the global context
Start with FII/DII flows, market breadth, delivery, F&O bans and deals. Then connect them to rates, volatility, PMI, positioning, ETF holdings and demand.
- A compact snapshot on Overview and the full dataset in Market Pulse
- Recent history inside each card, with the source date shown
- Live US 10Y in the price strip and the FRED daily series labeled separately
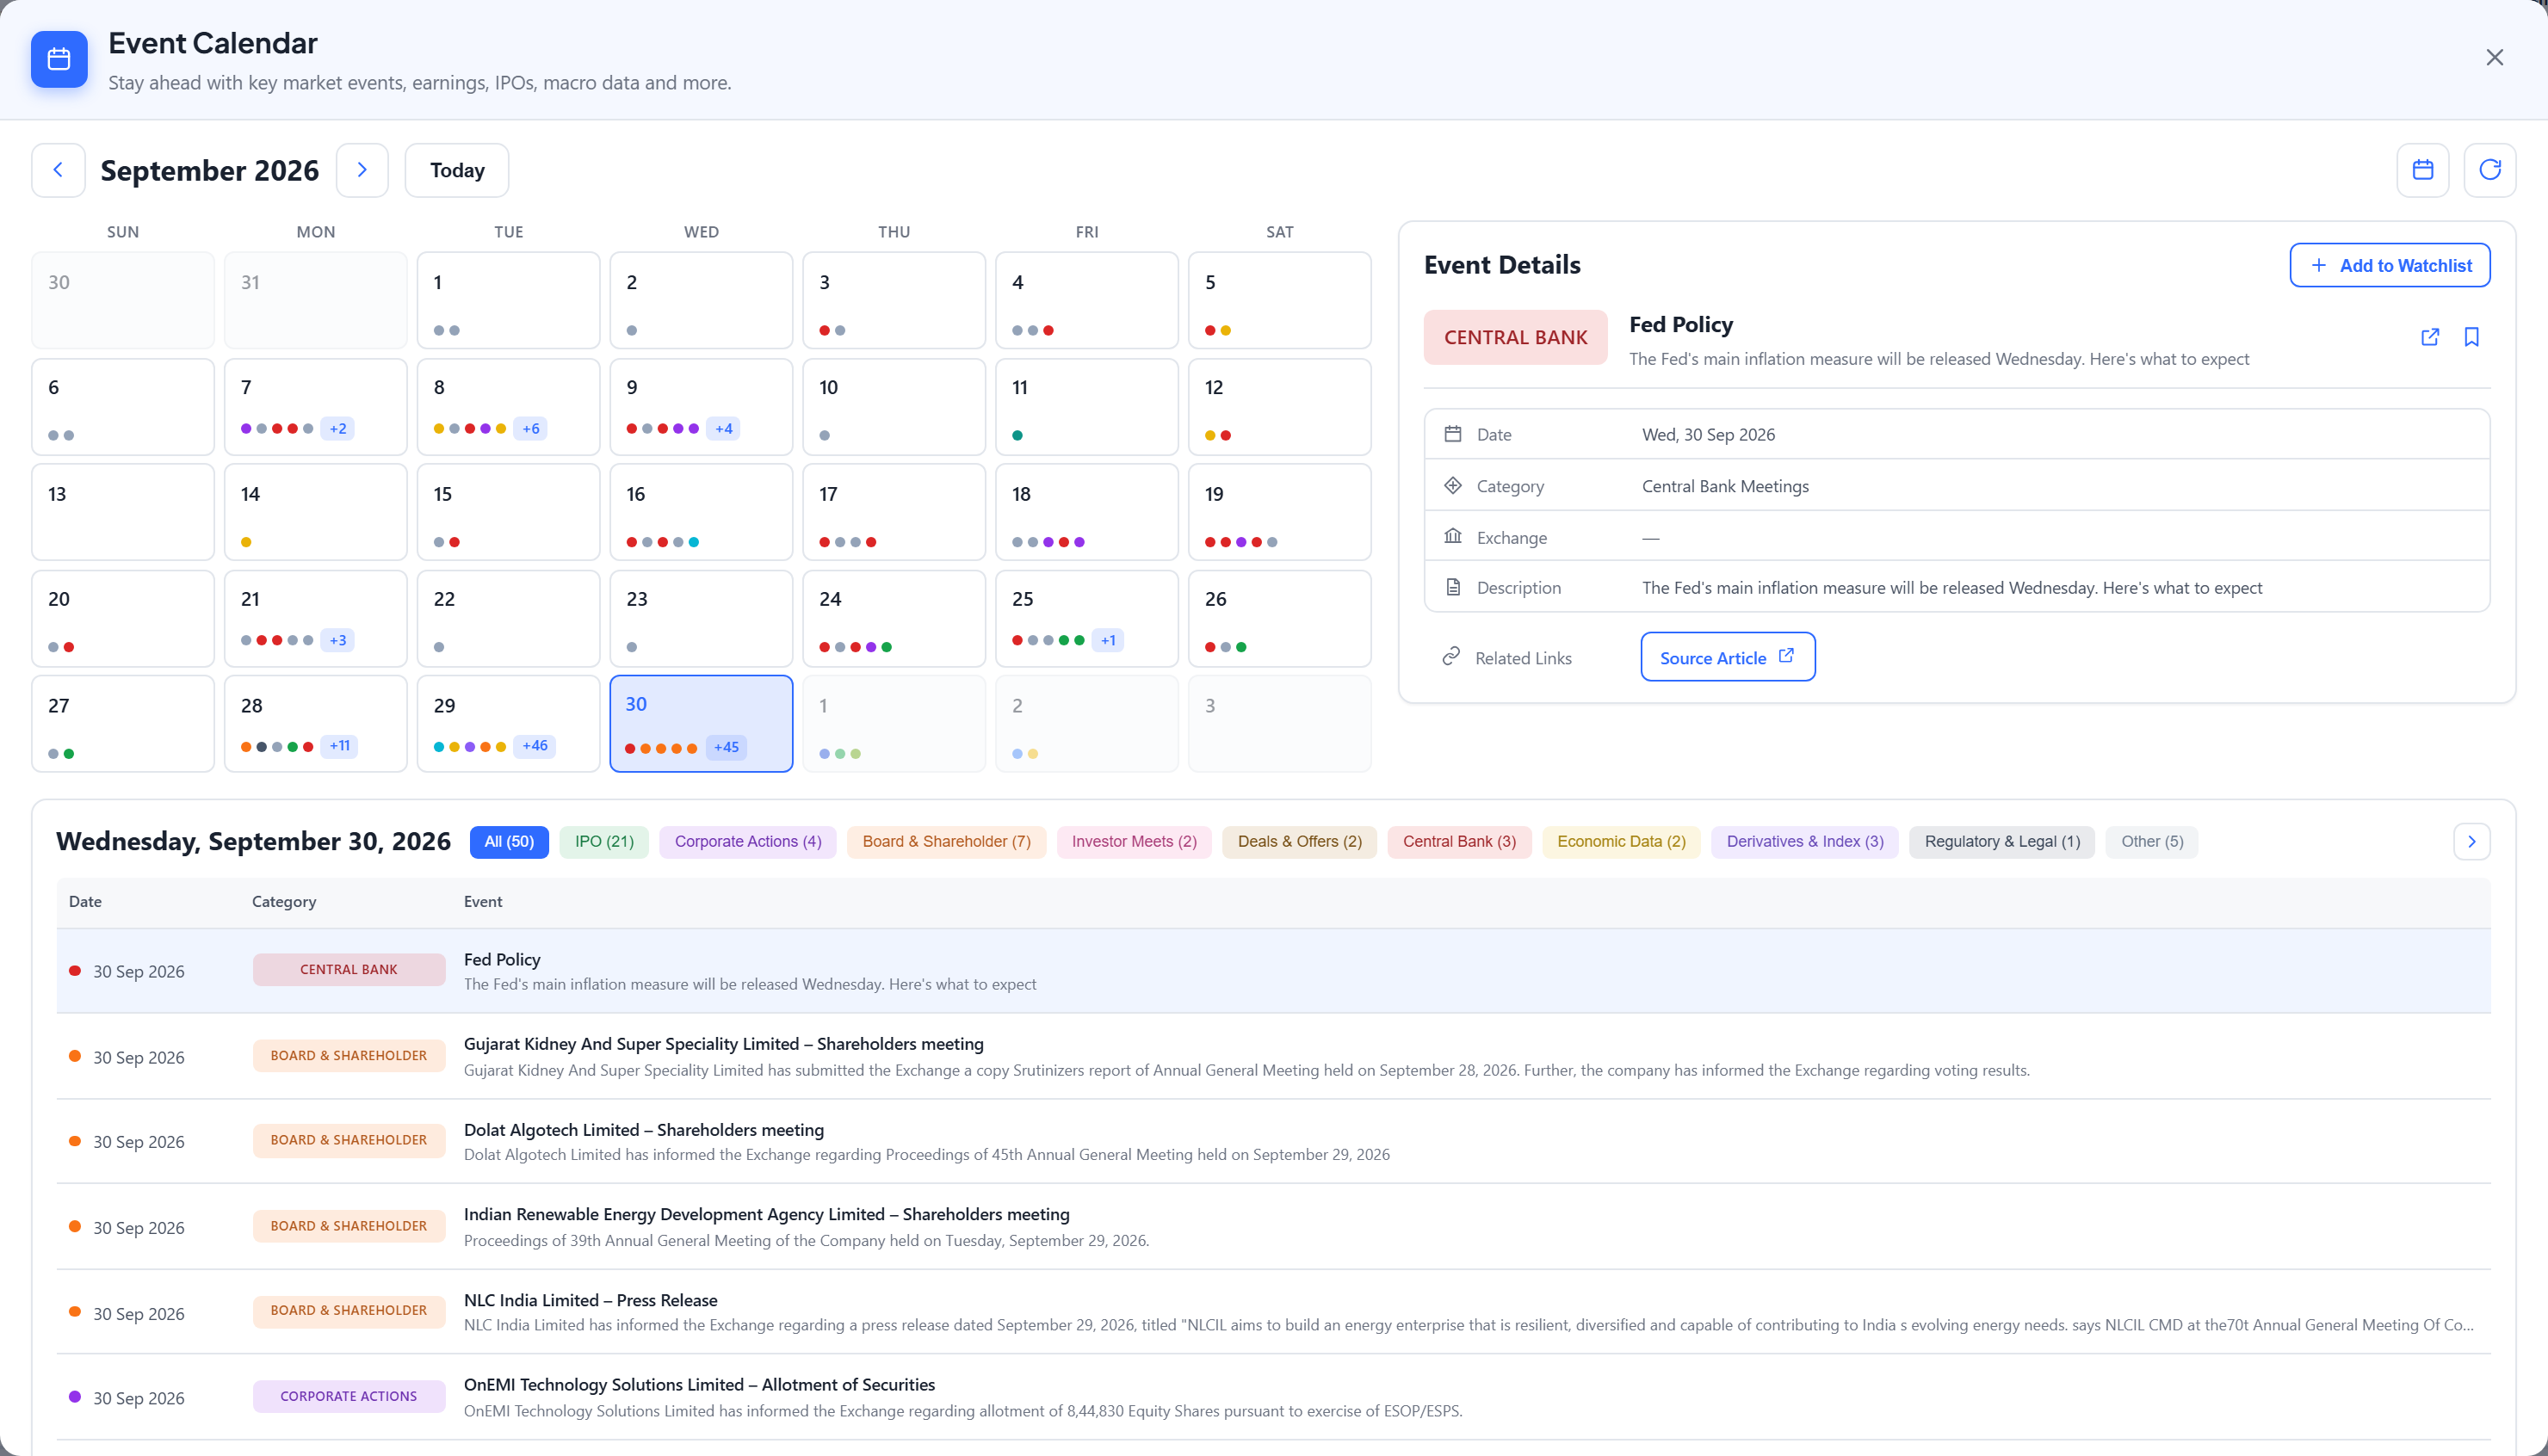
Never miss a result, IPO or RBI meeting
A market calendar built from NSE filings, the news and official RBI, Fed and inflation schedules, colour-coded by type.
- 17 event types, from earnings to F&O expiry
- Watchlist the events you care about
- Save events and add them to Google, Outlook or Apple Calendar
Every ticker, one click from its chart
Start with 15 broad benchmarks, sign in to add 10 of your own on Free, and click any price for its chart, ranges and market context.
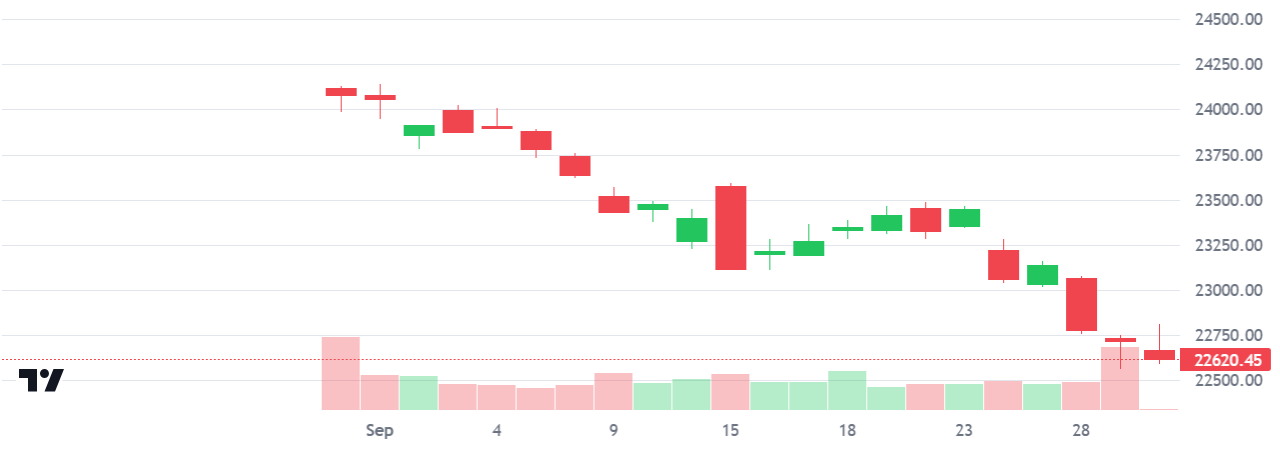
- Line or candlestick charts with volume
- Returns over 1 week, 1 month, 3 months, 6 months, 1 year and year to date
- The ticker's news, sentiment and upcoming events
Stay ahead of the markets
Start free in seconds. Upgrade to Pro when you want 50 price tickers and your own X Live Wire.